Turn scattered operational data into reports that help answer specific business questions. We help define useful measures, connect the available sources, and build a clear view for regular decision-making.
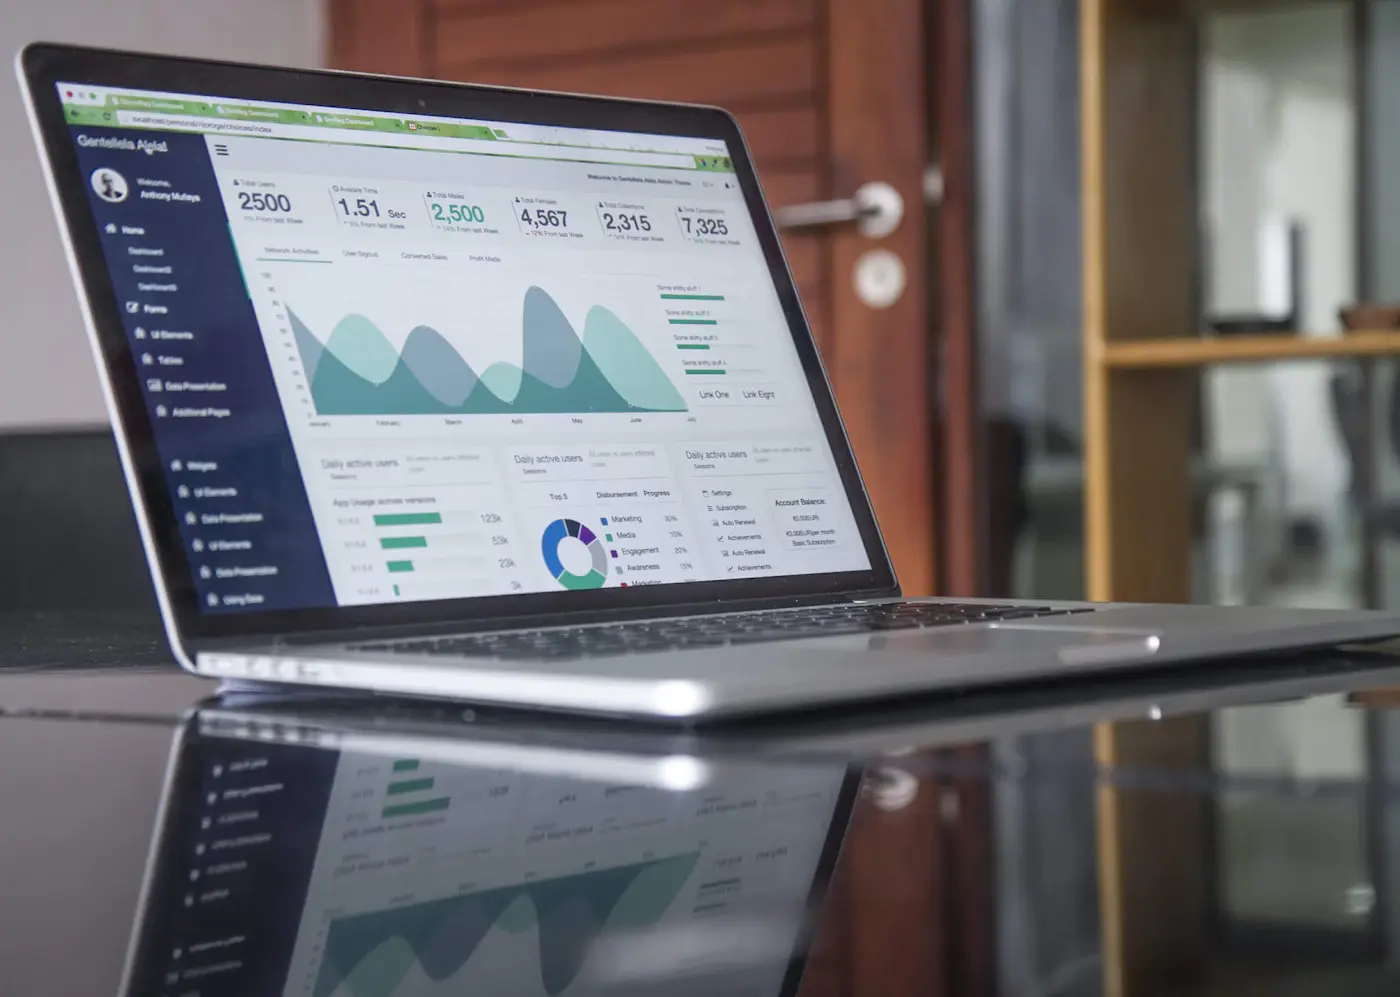
An illustrative view of the work behind analytics & reporting
The problem behind the brief
A dashboard cannot fix unclear definitions
Teams can reach different conclusions from the same chart when metrics have competing definitions or source data is incomplete. A useful report makes those assumptions visible.
01
Agreeing what each metric means and how it is calculated
02
Combining sources with different update schedules
03
Separating actionable signals from vanity measures
04
Protecting access to sensitive business data
What you are really looking for
What decision makers need from analytics
A dashboard should answer the questions people use to run the business. The work starts by agreeing on what each measure means and which source is authoritative—not by choosing chart colors.
01
Which recurring decision should this report help someone make?
02
How is each metric defined, and who can confirm the definition?
03
Which source is authoritative when systems disagree?
04
How current must the report be, and who can access it?
What the work can include
Reporting people can interpret and act on
A project is shaped around the parts that matter to your business. We define the deliverables and responsibilities together before work begins.
01
Define questions and measures
A short list of questions and measures
02
Connect and validate sources
Data source and definition review
03
Design the decision view
Dashboards or scheduled reports
04
Explain refresh and limitations
Notes on interpretation and data limitations
The details that make it work
What trustworthy reporting needs
We bring these service-specific considerations into planning and review, so important trade-offs are discussed before they become expensive changes.
Metric definitions reviewed with the people who use them
Documented data sources, refresh timing, and limitations
A readable layout organized around real decisions
Access controls and a process for checking data quality
A considered approach
Align metric definitions before building the dashboard
We agree on what each measure means before building a dashboard, then validate figures with the people who know the underlying process.
 Analytics & Reporting · 0202
 Analytics & Reporting · 0303
 Analytics & Reporting · 0404